
Visualizing Solana Perp Liquidity
I recently built Solana Perp Liquidity, a tool for comparing order-book liquidity across Solana’s perpetual DEXs. It follows Pacifica, Phoenix, Bullet and Bulk. I added Hyperliquid only as a benchmark: it is currently the most liquid perp DEX, which makes it the natural comparison for the Solana books.
An exchange normally shows only what its book looks like now. This site keeps seven days of history, making it possible to see where liquidity waited, how long it stayed, and whether it traded or disappeared.
The tool follows SOL, BTC, ETH, HYPE and ZEC perpetual markets.
The rest of this post is a guide to reading the site. It is worth keeping one caveat in mind from the beginning: an order-book wall is a visible intention, not a completed trade or a prediction. It can move or be cancelled at any moment.
Start with the Map
Time runs from left to right and price runs from bottom to top. The candles show where trades took place, while the heatmap behind them shows the limit orders that were waiting to trade. Large market orders appear as green and pink bubbles. The two columns at the right summarize the current book and what traded over the visible period.
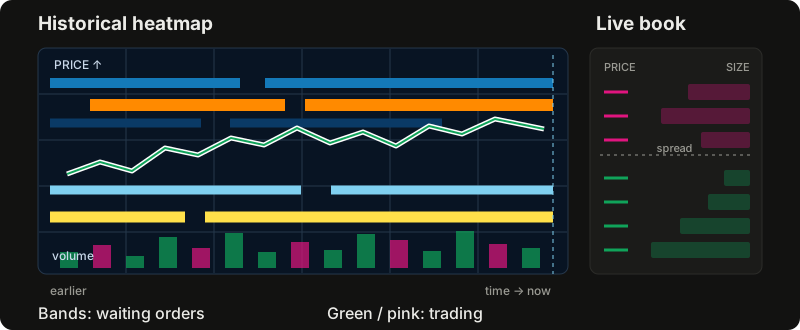
The coin selector is at the top left. Next to it, the live indicator shows how many venues are currently sending fresh books; hovering or tapping it shows each venue separately. A stale venue matters because the aggregated map is recorded only when all five venues are live.
The controls above the chart change the candle length and the visible layers. Candles chooses the venue whose price is drawn. Heatmap chooses whose books are shown. Trades, VWAP and Key levels add more context. Book opens the live order book. Depth, OI, Flow and Volume open as tabs under the chart; several can stay open, but one is shown at a time. They all share the chart’s time window. On a phone, these views open below the controls and above the chart; Book starts closed.
Read the Heatmap
Each heatmap cell represents the average number of dollars resting at one price during one time bucket. Brighter and warmer colours mean more liquidity. Since order sizes differ by orders of magnitude, the colour scale is logarithmic: moving from blue to orange means “larger”, not a fixed multiple.
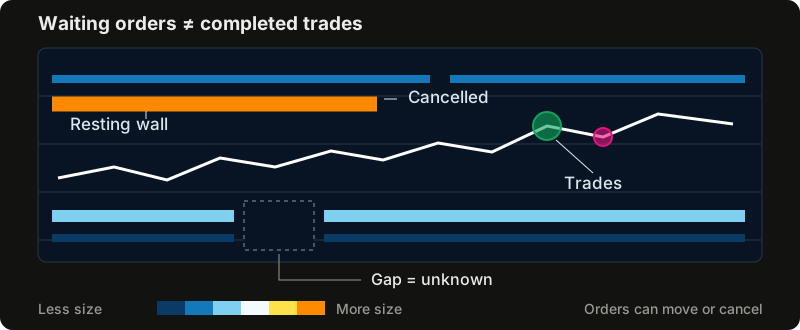
Horizontal bands are orders that stayed near the same price. A persistent band is often called a wall. Price may stall when it reaches one, but the wall can be cancelled before that happens. A wall that suddenly appears or disappears tells us that somebody changed the book; it does not tell us why.
The slider under the colour scale changes the visible range. Moving it to the right reveals smaller orders; moving it to the left keeps only the largest walls. Double-clicking the slider resets it. Smooth auto blends neighbouring cells so the map reads as bands, while off keeps every cell sharp. Hovering or tapping a cell shows its actual dollar value either way.
The map can show one venue or all venues added together. The aggregated view is deliberately strict: a second is included only when every venue was recorded, and a price row is included only where every venue’s published book reaches. This avoids presenting one venue’s liquidity as if it were the whole market.
A blank stretch means that not enough data was recorded. It does not mean that the book was empty. A dashed vertical line marks where recording began.
Read the Order Book
The Book panel is the current price ladder. Asks are offers to sell above the market and bids are offers to buy below it. The best ask and best bid are the nearest rows on either side; the distance between them is the spread. The mid is halfway between the two, but it is only a reference price and cannot itself be traded.
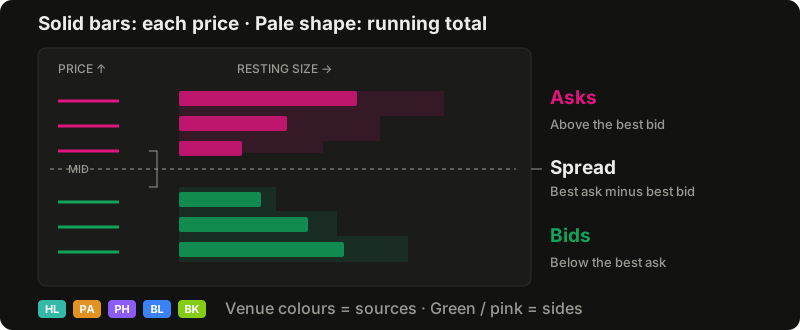
Each solid bar shows the dollars resting in one price row. The pale shape behind it is cumulative depth: how much liquidity a market order would cross from the current price out to that row. Group changes how much price each row contains, and Show switches between row size, cumulative depth, or both.
The venue chips choose which books are included. Aggregated adds them into one ladder, while Single keeps a separate ladder for each venue. Grey rows are outside a venue’s published depth and should be read as unknown, not empty.
Pull/stack compares the book with an earlier snapshot. A positive number means liquidity was added to a row; a negative number means it was removed. This is useful, but ambiguous: when price trades through a row, a fill can look like a cancellation. The site greys out those rows instead of pretending it knows which happened.
Follow Large Trades
The bubbles on the chart are completed market orders. Green means a taker bought by lifting asks; pink means a taker sold by hitting bids. A bubble’s area is proportional to its dollar size, and its venue chip shows where it traded. Hovering or tapping reveals the venue, size and average price.
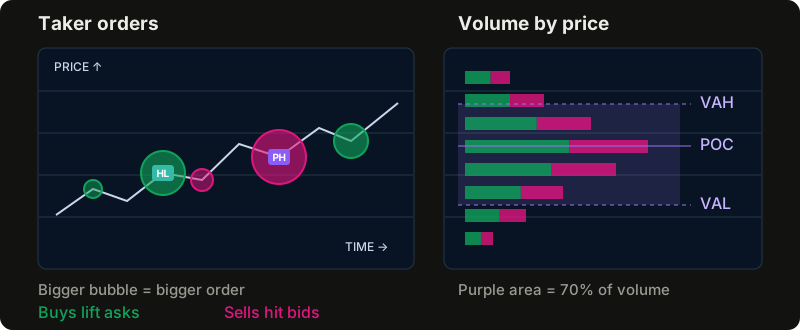
In Layers → Trades, the minimum size controls which orders are visible. The venue filters are independent from the heatmap’s venue choice, so it is possible to compare, for example, a Pacifica book with large trades from all five venues.
Venues publish trades in different forms. Phoenix identifies an order directly. Hyperliquid groups fills by taker, side and moment, Bullet by transaction, and Bulk by taker and moment. Pacifica does not identify which fills belong to one order, so fills on the same side in the same millisecond are treated as one. This reconstruction is useful, but it is still an approximation of the original taker order.
The Traded column beside the heatmap groups completed trades by price over the visible time range. Green is taker buying and pink is taker selling. The longest row is the point of control (POC). The purple range between VAH and VAL contains 70 percent of the traded volume. The delta is taker buys minus taker sells.
This profile requires trades recorded at individual prices. An exchange’s historical candles can supply old prices and total volume, but not the prices at which that volume traded, so they cannot reconstruct the profile.
VWAP and Key Levels
VWAP is the volume-weighted average price: every traded price weighted by how much traded there. The tool can calculate it for a UTC day or for a week beginning on Monday. Optional bands show one and two weighted standard deviations around it.
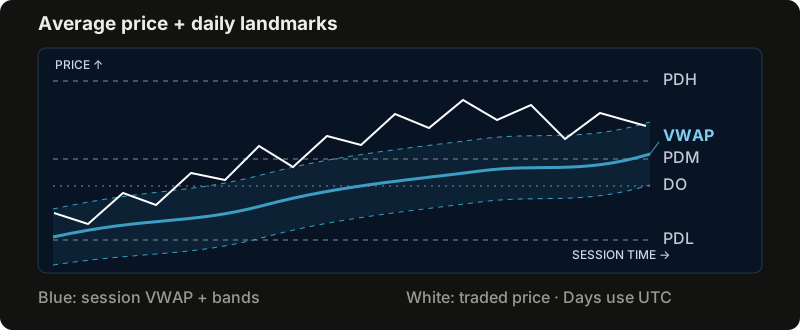
The line starts again with each session. The current price above VWAP means it is above the session’s volume-weighted average; below VWAP means it is below the average. Before detailed trade recording begins, the calculation uses the typical price of the venue’s candles and marks the result as an estimate.
Whale VWAP applies the same idea only to the large market orders shown as bubbles. It draws separate averages for large buys and sells, using the minimum size and venue filters under Trades. This makes it possible to compare the average price paid by large taker buyers with the one received by large taker sellers.
The key levels are based on UTC days:
- DO is the current day’s open.
- PDH is the previous day’s high.
- PDL is the previous day’s low.
- PDM is the midpoint between the previous day’s high and low.
These prices are commonly watched because markets often become active around them. They are reference points, not promises of support or resistance. A level outside the current price range waits at the edge of the chart with an arrow until the view is zoomed out far enough to include it.
Depth, Open Interest, Flow and Volume
The four tabs below the chart answer different questions.
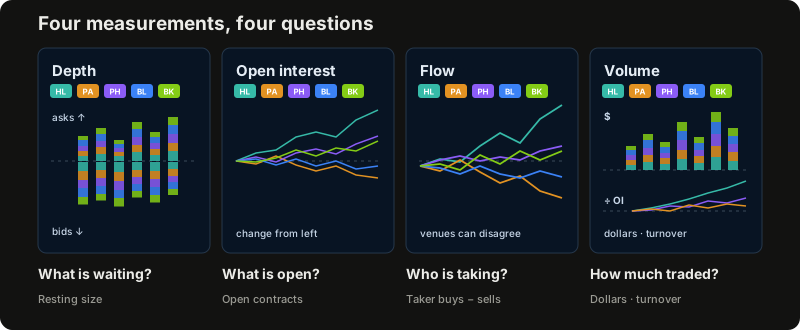
Depth asks what is waiting. It adds resting bids and asks within a chosen distance from the market. Its own venue chips choose which books count, and each bar is split into the selected venues’ colours. A strong column highlights an unusual imbalance, but those orders remain cancellable.
Open interest asks how many contracts are open. Each venue has its own coloured line, shown as the change since the left edge so venues of different sizes fit on one scale. The chips choose which lines appear. Every contract has both a long and a short, so open interest alone does not reveal direction, and a fall cannot by itself identify liquidations. Like Flow, its change lines restart when the visible time window changes.
Flow asks who is taking liquidity. It adds market buys minus market sells from the left edge of the visible window. A rising line means net taker buying during that period; a falling line means net taker selling. Each venue has its own line because venues can disagree, and the chips choose which lines appear.
Volume asks how much traded. In $ mode, each candle’s bar shows recorded traded dollars, split into the selected venues’ colours. The header gives each venue’s total and share over the view, or its figures for the candle under the pointer. The chips choose which venues count.
Unlike the Traded profile beside the heatmap, which groups volume by price, the Volume tab follows it through time.
÷ OI compares each venue’s cumulative volume since the left edge with the dollar value of its open interest: how many times its positions turned over. A line far above the others can suggest trading back and forth for points or rebates, but it does not prove why that volume occurred.
These tabs are context, not standalone trading signals. A divergence between price and flow, an imbalance in visible depth or unusually high turnover is a reason to look closer, not proof of the next move.
Move Through History
Dragging the map moves through time and price. Scrolling on the map zooms both axes. Scrolling on the price scale changes price only, while scrolling on the time scale, or holding Shift, changes time only. On a phone, one finger scrolls the page and two fingers move the map. Pinching zooms it: a sideways pinch changes time and a vertical pinch changes price.
Double-clicking, double-tapping, pressing R, or using the target button returns to the live edge and fits the current price. The borders beside the Book and above the active tab can also be dragged; double-clicking a border resets its size.
The tool keeps seven days of recorded data. Each venue’s book is sampled once a second, and each heatmap column averages the seconds in its candle interval. A wall that flashed for one second therefore fades, while one that stayed for the entire interval is drawn at full strength. When a new venue is added, its aggregate begins with that venue’s first recording; the older individual venue history is still there.
Before detailed recording began, the site may still show candles obtained from the venue. Those candles are useful for price history, but they do not contain enough information to reconstruct book liquidity, order-level trades, Flow, the Volume tab or a volume profile. Check the live indicator, the recording boundary and any stale-data notice before comparing periods.
Try It
The easiest way to understand the views is to open Solana Perp Liquidity, choose a coin, and move between the heatmap, live book and executed trades at the same moment. The Guide button in the top bar presents the same material as eight short, illustrated topics inside the tool.